Investments - Oct 29, 2025
Are We in a Bubble?

By Joel Heymsfeld
Published October 29, 2025
I’ve been asked more than once lately, “Are we in a bubble?” The short answer is: probably not.
To put today’s environment in perspective, it’s helpful to look back at a few true bubbles I’ve witnessed over the course of my 50+ year career. Each shared a common theme — investor euphoria untethered from fundamentals — and each offers lessons that still hold value today.
- The Nifty Fifty (Late 1960s – Early 1970s)
During this era, investors believed fifty large U.S. companies were so dominant that their growth would continue indefinitely. Stocks like Polaroid, IBM, and Coca-Cola were considered “permanent holdings.” By 1972, Polaroid traded at a price-to-earnings ratio (P/E) above 90, and the group as a whole carried a P/E over 40 — roughly double that of the S&P 500 at the time.
The correction that followed in 1973–74 was severe, and most of these stocks never regained their lofty valuations.
- The Energy Boom (Early 1980s)
Following two major oil shocks in the 1970s, energy stocks soared. By 1980, the energy sector represented more than 30% of the S&P 500 — an extraordinary concentration driven by unsustainable commodity prices.
Today, that sector’s market share is below 3%, a reminder that even “must-own” market segments can fall from favor when conditions change.
- Japan’s Asset Bubble (Late 1980s)
At their peak, Japanese equities accounted for 45% of the World Stock Index, and the land under Tokyo’s Imperial Palace was said to be worth as much as all the real estate in California.
When the bubble burst, both stock and real estate values collapsed. Today, Japan makes up less than 5% of the World Index, and its property values remain a fraction of their former peaks.
- The Dot-Com Bubble (Late 1990s – Early 2000s)
The internet revolution sparked a wave of excitement and speculation. Companies with little to no profit went public amid promises they’d be “cash flow positive in a few years.”
At its peak in 2000, Cisco Systems traded at an estimated P/E of 272. When the bubble burst, the market suffered a deep correction, followed by the financial crisis of 2008–09. It took the S&P 500 more than 13 years to recover its early-2000 high.
What About Today?
The current surge in spending around artificial intelligence (AI)— data centers, chips, and related infrastructure — has drawn comparisons to past manias.
But here is the key difference so far: Earnings growth has largely kept pace with share prices. We haven’t seen the kind of multiple expansion or speculative frenzy typical of historical bubbles. The companies leading this trend are profitable, cash-generative, and integral to the modern economy.
Two charts show why Today’s AI-Build is different than the Dot-Com Bubble:

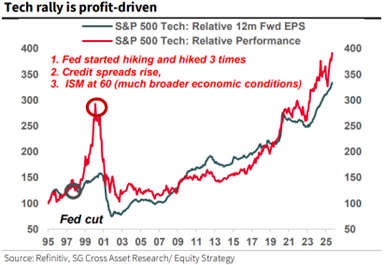
That said, for stock market valuations to remain justified, future growth in AI adoption must materialize — turning today’s capital expenditure into tangible, recurring revenue.
It’s also worth remembering that even Alan Greenspan’s famous warning about “irrational exuberance” in 1996 didn’t mark the top of that cycle. The S&P 500 went on to gain more than 20% annually for three more years. Markets often continue to rise long after valuations begin to look stretched.
Managing Risk in Any Environment
No one can predict exactly when enthusiasm turns into excess. What we can do is manage risk thoughtfully and deliberately:
- Diversify by sector and asset class.
- Rebalance periodically to keep portfolios aligned with long-term goals.
- Stay disciplined rather than reacting to headlines or short-term swings.
At Princeton Global, the investing principle remains simple: “Eat well, sleep well.” That balance — between growth and peace of mind — is the essence of prudent investing.
If you’d like to talk about how to keep your portfolio grounded through all market cycles, we’d love to hear from you.